
This page details what is new in version 4:
Analysis . Data review . Import/Export/Reporting . Miscellaneous. Breaking new ground
Analysis
- More analysis options available: Standard BCC/CCR, Weighting, Additive (slack based), allocative (cost based).
- Malmquist indices now available for analysing changes over time.
- Super efficiency calculation option.
- More variables - no limit to the number of variables you can import or enable. The number you can use is subject only to the solver operation.
- Categorical variables - you can now define categories and analyse each sub-set independently. If the data is hierarchical, then you can use them incrementally. For example, if your category represented the age of children between 5 and 9, you could compare the 5 year olds only with themselves, but the 6 year olds with the 5 year olds too, the 7 year olds with the 5 and 6 year olds, and so on. The order is fully configurable using the category manager.
- We have changed the unit limit from "unlimited" to "20,000+" units to better reflect the large capacity as people read "unlimited" as only a little over the 5,000 of the prior capability. There is though still no limit other than the solver's ability to solve the data set. Some customers have analysed 100,000 units with three variables. If you have a large data set, let us know if you find a limit. Note also that large data sets will be solved in less time in version 4 if threading is enabled, particularly on a multi-core PC.
- Fully threaded calculation engine which means that you can get your results faster. First, it will automatically split large data sets into segments for simultaneous analysis. Second, if a categorical or time analysis is active, they will be done simultaneously. Finally, you can set up more than one comparison, and they will be calculated simultaneously. The actual number of threads that can operate on your data depends on the licence purchased. The larger the number of units, the more threads that are available. And of course if you want to restrict the number yourself, you can.
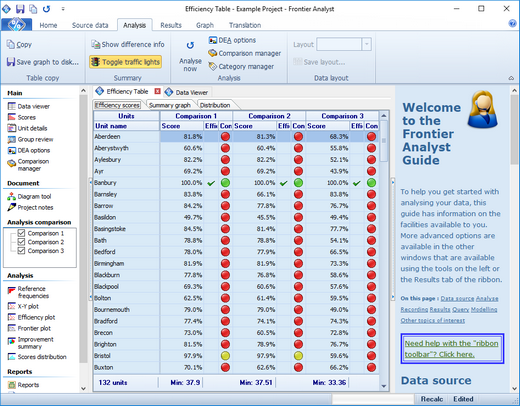
- Comparisons are now available within the software, and side-by-side results in any of the displays (except the Frontier Plot where it wouldn't make sense). This makes it very easy to compare the effect of different analysis options, and is a leading breakthrough only available in Frontier Analyst 4. (Number of comparisons available depends on licence purchased.)
- The analysis creates a text log to allow you to review the details of what was done, if required.
- You can specify a variable is "undesirable" and have it automatically inverted. In DEA, values assume that bigger is better. Inverting them allows this to be reversed, and then reversed on the results too for ease of use.
The analysis options in Frontier Analyst have been expanded to provide more of the analysis that people have requested. Malmquist indices, allowing you to see how units are improving, or not, are now available, as well as allocative to see how units are working with the actual cost of their inputs. Comparisons allow you to create more than one set of analysis options at the same time, and see them side-by-side, something which is ground-breaking and keeps the Frontier Analyst tradition of making efficiency analysis accessible to all.
Data review
- Unit display now allows at-a-glance or focused review operation with split displays.
- Process diagram for modeling your unit process.
- All tables now improved with sorting, filtering and grouping where appropriate.
- Group review window allows you to compare various sets of units against each other with graph and pivot options.
All of the previous graphs and tables in Frontier Analyst are improved, and all allow you to see multiple comparisons side-by-side for easy comparison. (The Frontier Plot is the exception and shows only one comparison at a time.) We have worked to take advantage of modern large screens, and the unit details window can either be used in an "at-a-glance" overview with 4 graphs simultaneously displayed, or on a mode which is effectively the same as the old tab display. Some of the displays also show the values according to "traffic light" colouring to allow you to set a band for units.
Import / Export / Reporting
- Reporting has been changed to a word-processor based solution for easier export to Word (single click solution), and a more understandable template editing. This means you can now customise your reports more easily. (Template editing depends on licence purchased.)
- You can now import data direct from a SQL database using Microsoft's ADO technology. We have tested against SQL Server and Oracle, but any database should be accessible. The query used is stored for repeated use.
- Import of Frontier Analyst 3 projects is a simple operation - just open the file and it is read automatically.
Importing has been enhanced with more options including a SQL database import option to allow you to connect direct to your corporate database. Export is enhanced by the various tables allowing you to sort and filter before you export them, allowing you to get only the information you require. Reporting has been changed to help you generate more meaningful custom reports by using a word-processor as the engine which then allows quick export to Microsoft Word. And of course the reports fully support the comparison feature, allowing grouping by unit then comparison, or comparison then unit.
Miscellaneous
- Toolbar now using Office 2007 ribbon style for ease of use.
- Automatic update facility to check if a newer version is available on the web, and if so to download it.
- Help is improved and also available as a PDF version. The standard purchase does not include a printed copy of the manual, but is available as an optional (charged) extra.
- Microsoft MSI compatible installer for easy deployment and installation.
- An optional licence manager is available at no charge for group use if you wish to control the licenses you have purchased. This allows you to be sure you are complying with the licence terms, while allowing maximum flexibility for your users.
- On-screen "guide" to help you get started with the software.
The progress of computer technology is such that we now have more screen space, and faster processors (typically with more than one "core" processor available). With Frontier Analyst version 4 we have taken advantage of these changes, and sought to ensure that the screen is best used (especially the at-a-glance unit display), and to take good advantage of the dual and quad core processors by allowing you to use threads to speed the various analysis functions up. A large analysis for example can be split across 4 cores all at the same time to reduce the time taken significantly.
Updates to the software since its version 4.0 release have updated compatibility with later operating systems.
Many of these improvements have been the result of user feedback, and we look forward to hearing your ideas to take Frontier Analyst forward as the leading DEA tool.
Breaking new ground
Frontier Analyst® was first released back in 1995 with the purpose of making data envelopment analysis (DEA) available to the typical manager or researcher who wanted to apply DEA without having to master the mathematics. It is interesting to review the changes in the DEA world over that time, and which brings us to Frontier Analyst® version 4.
There are in essence two branches of software for DEA – one branch is focused on providing as many models as possible which can be applied to the data, and the other is focused on making DEA accessible. The primary purpose of the former seems to be to allow the DEA researcher to experiment with the ever-expanding range of models that someone studying DEA might want to play with. This is quite admirable, and I’m sure useful to those who need it, but there is typically no guidance as to which model should be chosen for a particular purpose, and very little in the way of interpretation of the data. Most often you are given either a long listing (perhaps nicely formatted) or a grid of values to interpret yourself. If there is a unit that can’t be solved, it meekly ignores the issue, and leaves it for you to find.
The alternative is to try to help people interpret the data. Frontier Analyst® was the first application to provide graphical overviews of the data. It is perhaps flattering that some of the software developed since includes a few of the graphs that we first provided all those years ago. Notice though that Frontier Analyst is the only software providing the Frontier Plot. Could this be because it requires custom programming that isn’t available in the likes of Excel? By using a generic host, you gain some apparent advantage, but in reality it becomes a bit of a hindrance. The results layout is not customisable, and it can’t be tuned to fit DEA precisely to create a useful efficiency analysis tool.
In developing version 4 of Frontier Analyst®, we wanted to expand the capability enormously, and in doing so we realised that there were some very sticky problems on presenting the data we wanted to show. Our focus, as always, is on helping people find the interesting data, and hiding some of the complexity that might occur. As part of this process we reviewed the other software on the market. I’ll not comment about their reliability, flexibility or anything (but please do make sure you try the demonstrations to compare against ours if you are thinking of buying one!) but we discovered that no other software is even attempting to achieve this goal. Take for example comparing the score results from two different analysis. We have worked on presenting the data in a manner that works well. Our scores display shows the various units with their results, and shows the min, max and difference between the two. With other software, you are presented with two disconnected listings, and you are left to work it out yourself. Likewise we went on to work out what would work well for users in each of the graphical displays we produce (including some new ones). Sometimes it makes sense to show the variables from each comparison against each other, sometimes it makes sense to show units from each comparison against each other.
When you are looking at a software package for DEA, make sure you are buying from someone who is developing good software, has the models you need (and advice on choosing the one for you) and that they are working to help you solve your problems. Don’t accept anything less.
Enjoy Frontier Analyst® 4.
Frontier Analyst includes all these tools to help you explore and understand efficiency in your organization. The demonstration shows you all the features and how they can be used. Contact us, or click the Demonstration download button for your copy.